Currently, and historically, the only way for members of the suspension, vehicle dynamics, battery, or any other subteam of formula-slug to get data or visualizations is to ask a member of the data team, who will then pull the relevant files from fs-data so they can write a python script to produce a chart using matplotlib or similar. This sucks for a number of reasons:
-
Several people are needed to create and iterate on visualizations
-
Scripts need to be updated to visualize new data
-
Complete disconnect between live telemetry and older data visualizations
New architecture
Notably, on FS-4, we will not directly log sensor values into a parquet, and will log CAN frames instead using the Logging and Telemetry Board. We will later process these into parquet files using a converter tool like this one (but maybe rewritten in python)
We will keep using as many of the same signal names (try to make FS-4 DBC signal names as similar as FS-3 as possible)
For telemetry, the LTB will not stream decoded signals, and will instead stream raw can packets over some currently undefined TCP protocol. Live-decodding for live telemetry will be done on a ground station device, which will either be a linux laptop, or a duplicate of the LTB in a hard case, with a screen and keyboard.
The ground station device will upload data in small (<1s) chunks to a database running on a remote server. Logged data will also be able to uploaded to this server.
A Working Prototype
Using logs generated by the prototype logging board, this program parses and uploads to an influxdb database, which is configured as a data source for grafana, which allows me (and others) to make very pretty visualizations.
One thing that’s very cool about grafana, is that it has “dashboard level queries” and variables. This allows each dashboard to be configurable, and means one dashboard can easily be changed to show data from a different day, or a different time range of data, or anything like that.
It’s all based on SQL queries, which suck to write, but are very powerful for this.
Some sample dashboards and visualizations
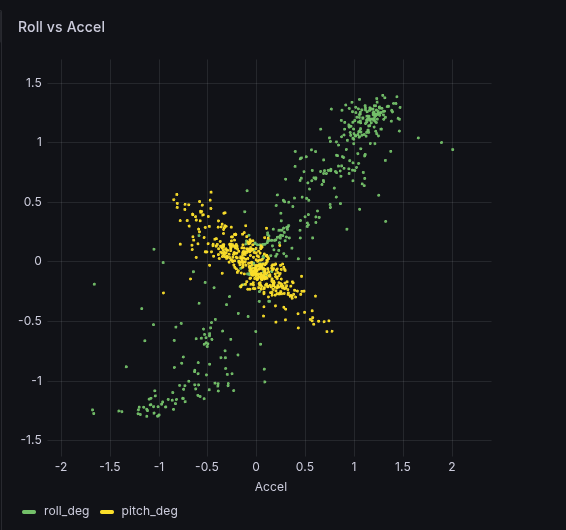
Here’s one of my favorites.. A plot of the cars roll and pitch (derived from filtered suspension position values) as a function of it’s linear acceleration (from the IMU) in the relevant axis:

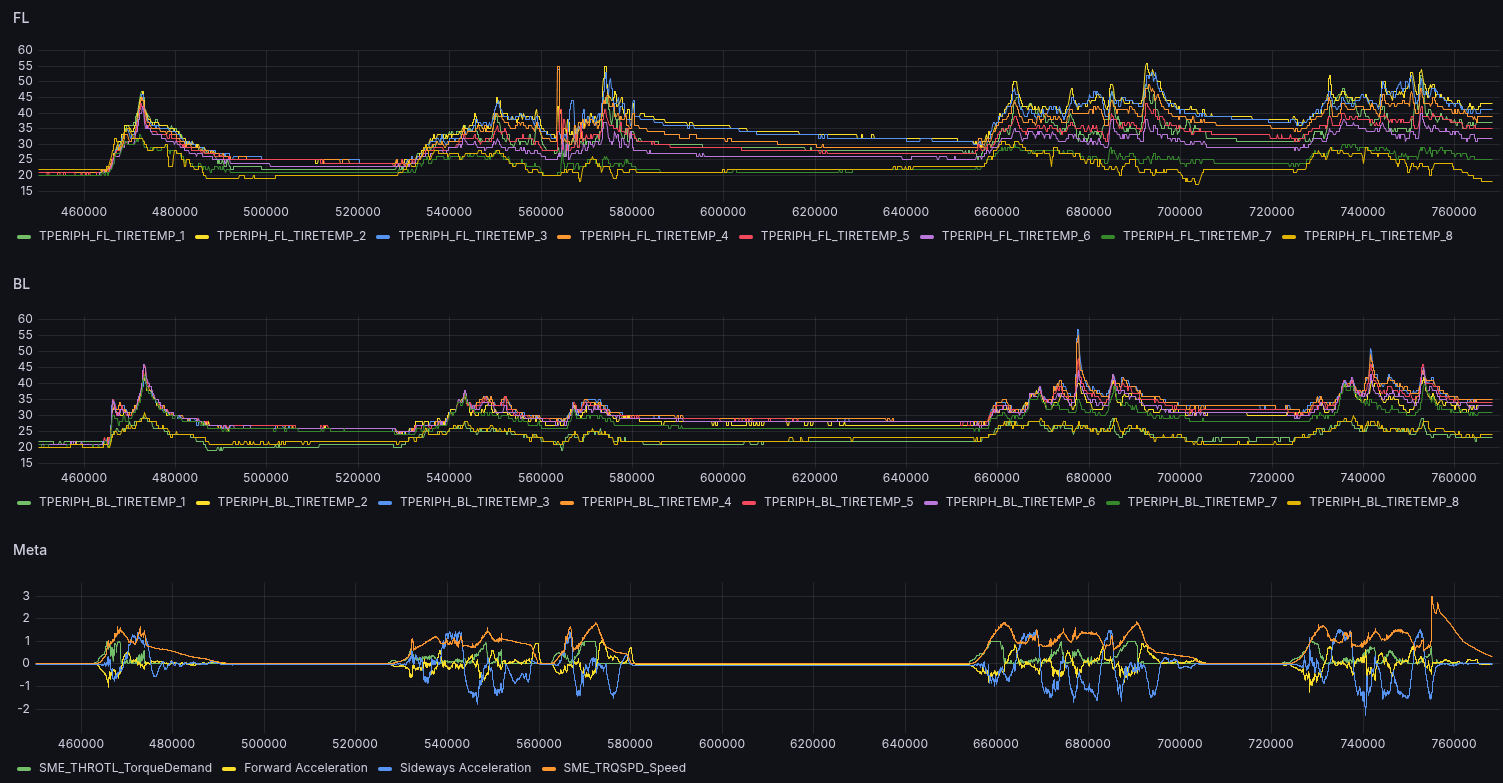
Much more commonly useful are time domain plots. Here’s one which shows the suspension travel (top) and car metas (acceleration and stuff) on the bottom. This plot makes it clear that the suspension seems to reach travel limits often, which is useful information for the suspension design team.

Here’s a plot that shows tire temperatures (across each tire from inside to out), and the same metas. The vehicle dynamics and drivetrain team are using this plot to chose the tire compounds we will use for FS-4

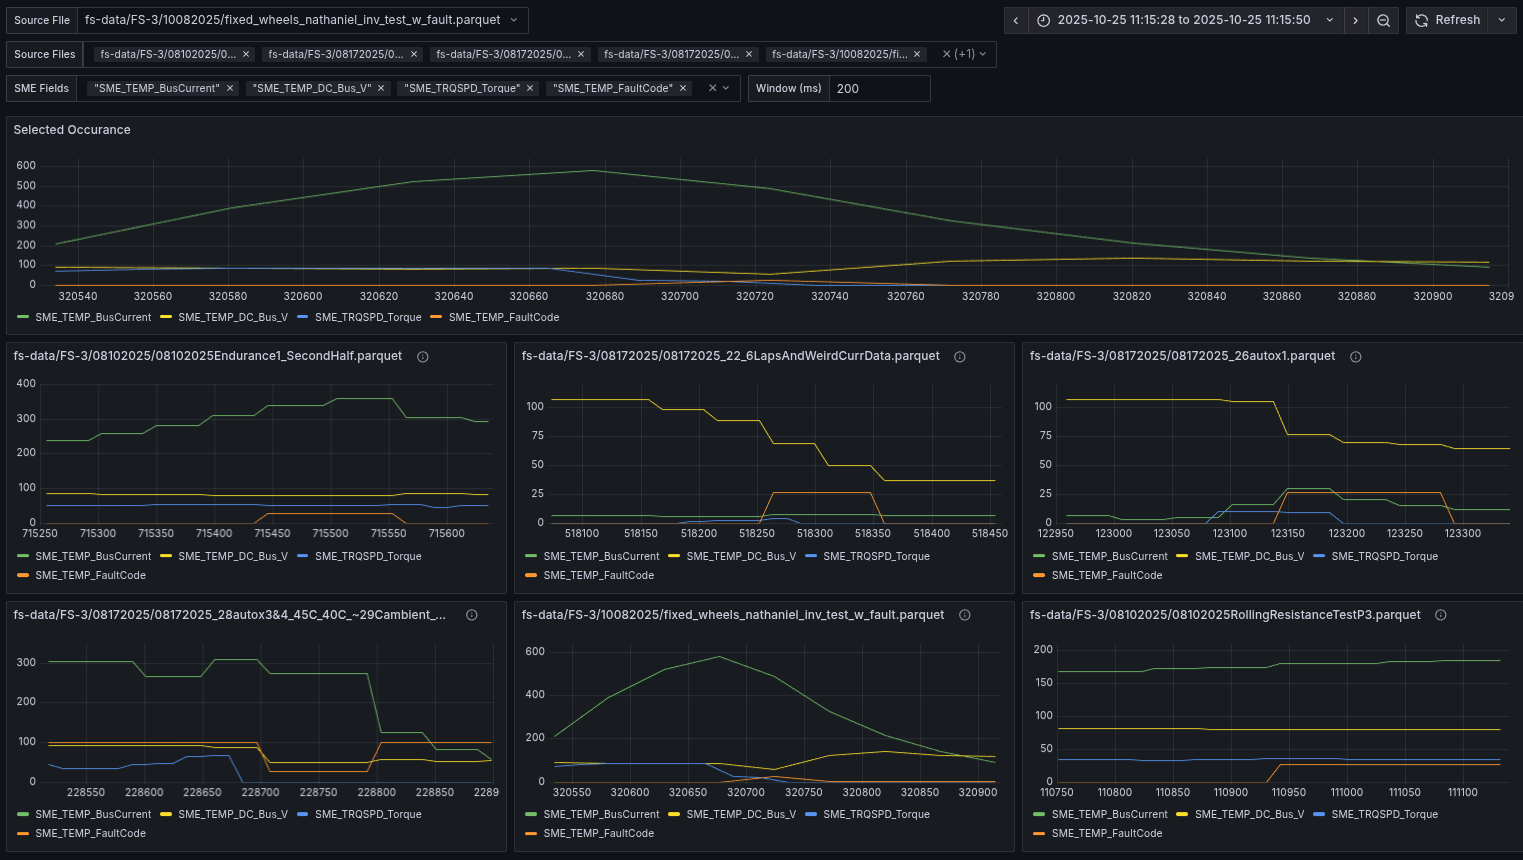
This one is a bit hard to explain, but very powerful. It allows you to select an inverter fault, some fields you think might be related, and chose from all the records where that fault occurs. Then it creates a plot for each of those occurrences, centered on the occurrence, and allows you to select a window in milliseconds to display on either end of the fault

Issues
-
Influxdb isn’t “properly” open source
- Some pretty important features are paywalled, including having different tokens with different permission levels
-
Influxdb’s optimization mostly forces me to put all logs into the same “time series” database, and then operate on it as a relational database… this makes it slow
-
Grafana is kinda slow… and it can only do 1s refresh, and each refresh will reload all data…
- It’s not really usable for live telemetry
Changes
-
Use ClickHouse DB instead of InfluxDB
-
It can operate directly on parquet files :)
-
It should be faster for this application
-
There are no paywalled features
-
-
Support ClickHouse IPC stream → historic live telemetry system based on lightningchart
-
Allows properly live telemetry that isn’t jank
-
It’s okay to use the difficult-to-configure historic live telemetry site because people won’t be doing deep data analysis while the car is driving.
-